Think with Google: Data Gallery
Discovering the value of data locked inside longform content, and helping users to do the same
AGENCY Huge
DATE 2015
ACTIVITIES Product design | Protyping | Content strategy
Think with Google, Google's publication for marketing professionals, always published articles based around compelling, data-driven insights. However, that data often only appeared in the body of an article, and in support of an article’s topic. To help give this data a broader appeal, Google created the Data Gallery, a destination for marketers seeking data to understand consumer behavior. The Gallery contains easily understood data points in a branded, stylized format, ready to be dropped straight into strategists’ decks.
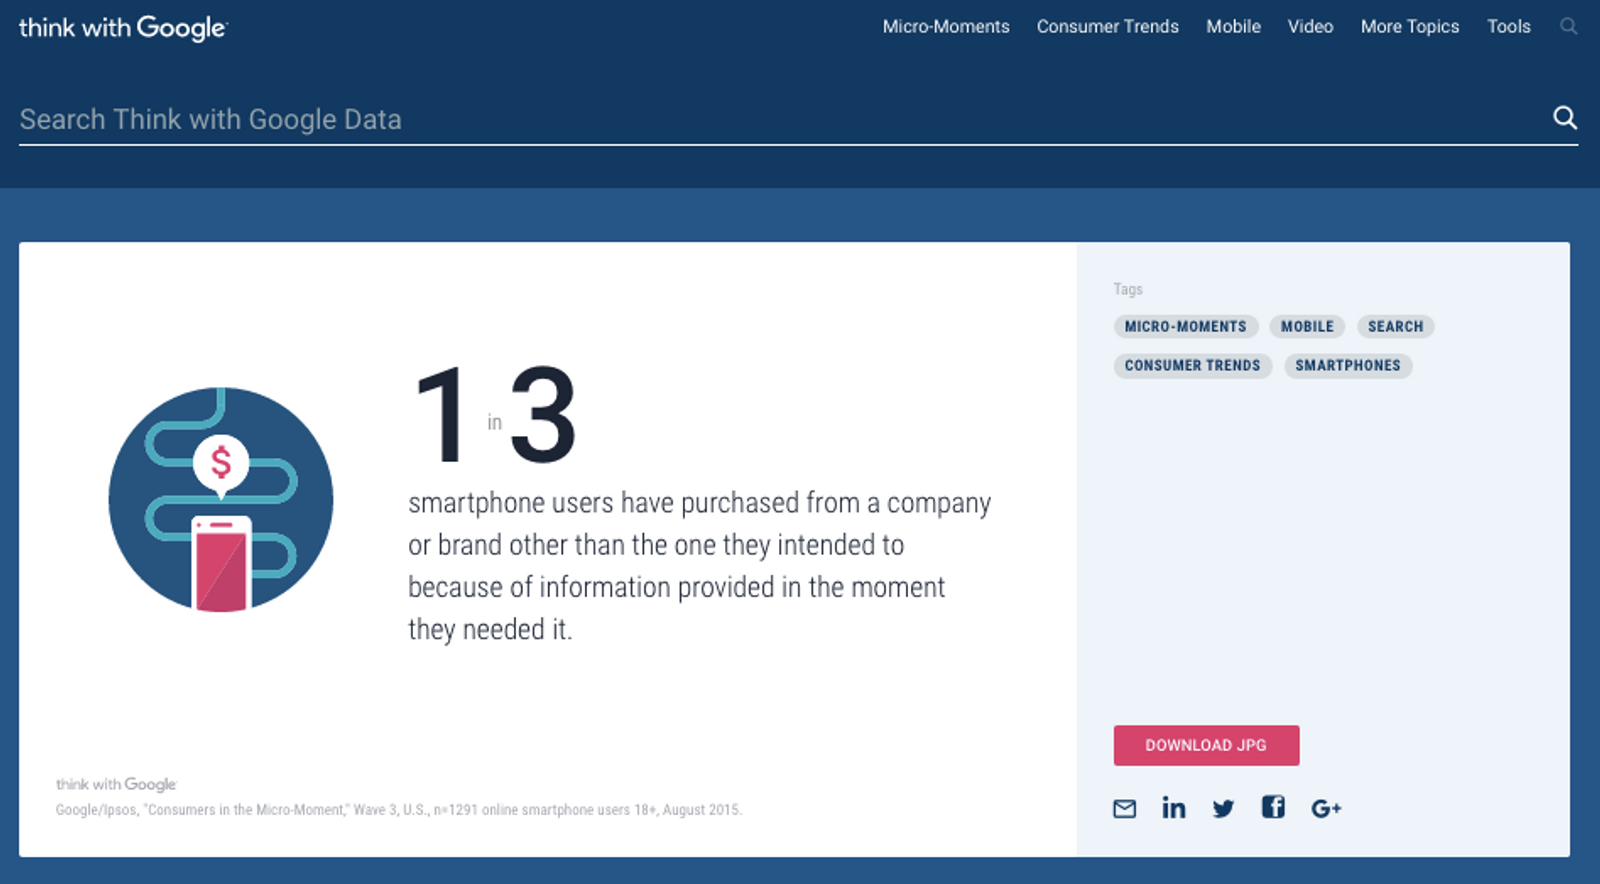
We created a schema for "nuggets" of content based on data that was previously only within the body of articles on the site
To plan for the level of effort for content creation and curation, we audited existing Think with Google articles, writing Python scripts to extract likely data points from existing articles, and generating a dataset against which labor and resourcing estimates could be made. We also used this dataset as the basis for a low-fidelity coded prototype to test the effectiveness of filtering based on currently existing metadata values. The audit also allowed us to create a content model to accommodate the various kinds of data points, and facilitated the design and editorial production efforts.
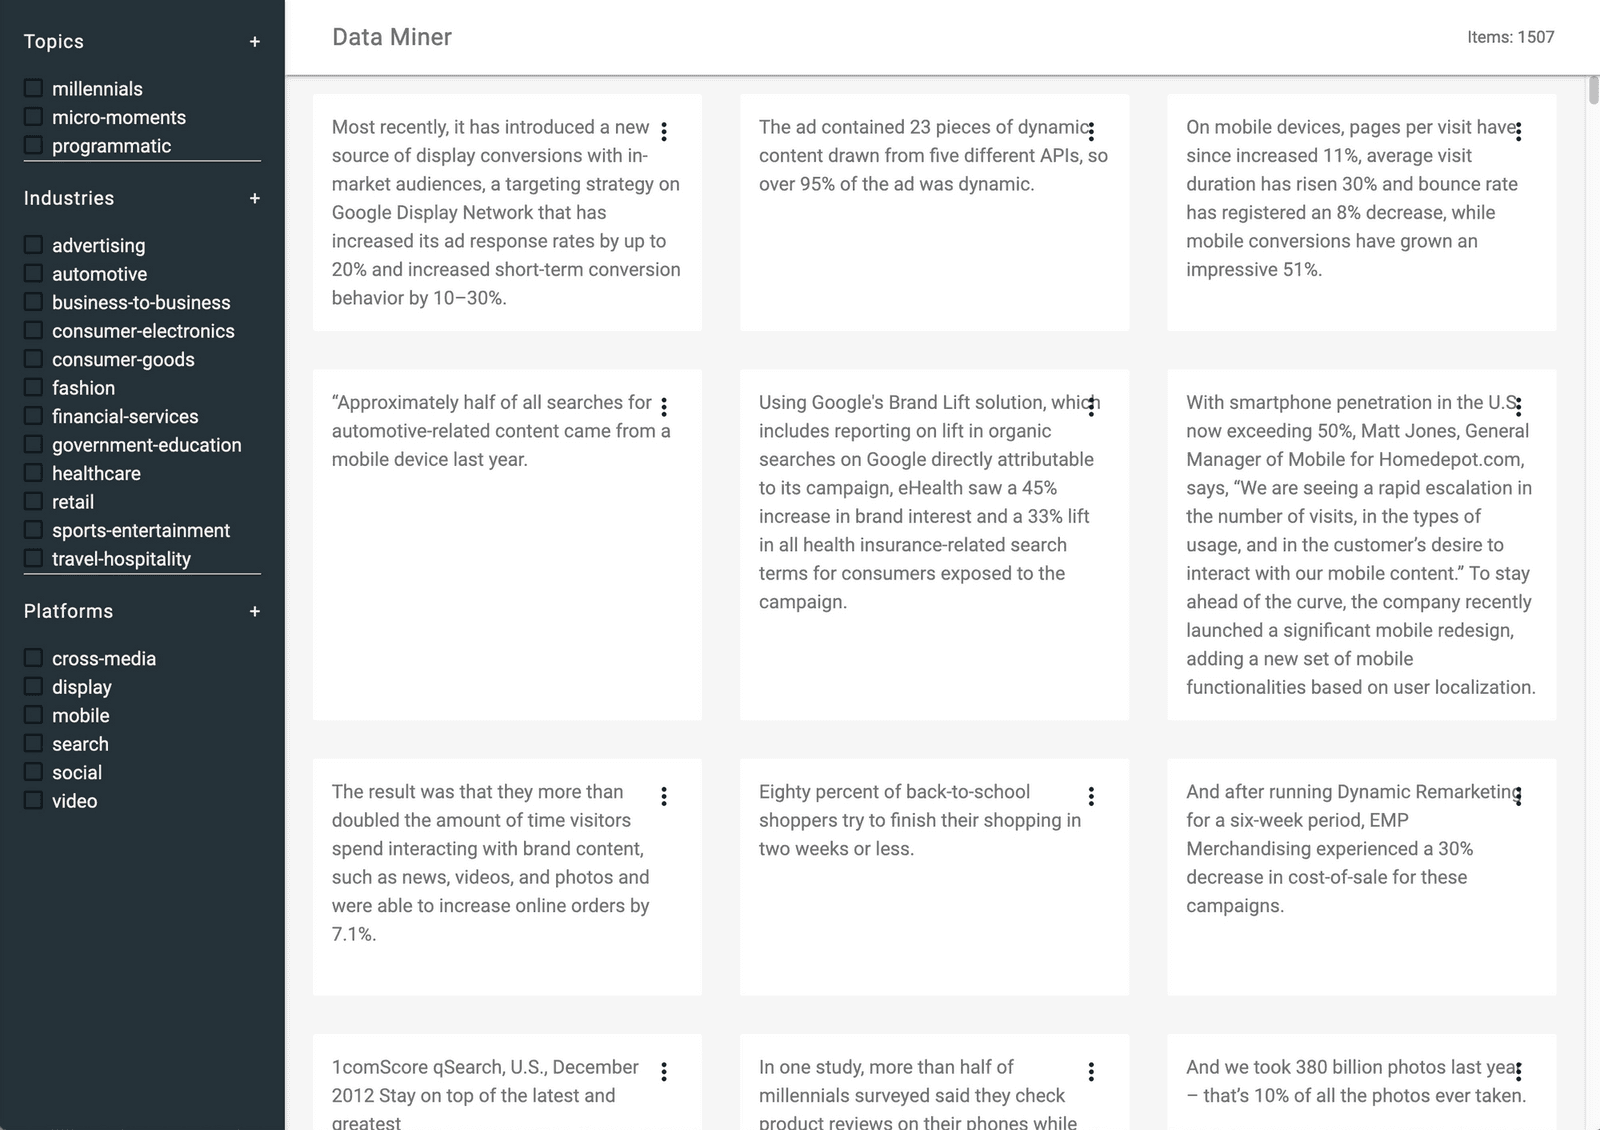
I built a web-based prototype to validate approaches to filtering and categories. Using the same set of content we were using to plan for content editing and creation helped demonstrate the kinds of results that might be surfaced when a user selected a specific set of filters.
Following the launch of data gallery as a separate site, Google rolled the functionality back into Think with Google as part of its search results page.